Evolution of the dust temperature of star-forming galaxies in the SFR-M∗ plane
Magnelli et al. (2014)
We study the evolution of the dust temperature of galaxies in the SFR−M∗ plane up to z ∼ 2 using far-infrared observations from Herschel. At all redshifts, the dust temperature of galaxies smoothly increases with rest-frame infrared luminosities (LIR), specific SFRs (SSFR; i.e., SFR/M∗), and distances with respect to the main sequence (MS) of the SFR−M∗ plane (i.e., ∆log(SSFR)MS = log[SSFR(galaxy)/SSFRMS(M∗, z)]). The Tdust−SSFR and Tdust − ∆log(SSFR)MS correlations are statistically much more significant than the Tdust−LIR one. While the slopes of these three correlations are redshift-independent, their normalisations evolve smoothly from z = 0 and z ∼ 2. We convert these results into a recipe to derive Tdust from SFR, M∗ and z, valid out to z ∼ 2. The existence of a strong Tdust−∆log(SSFR)MS correlation provides us with several pieces of information on the dust and gas content of galaxies. Firstly, the slope of the Tdust−∆log(SSFR)MS correlation can be explained by the increase in the star-formation efficiency (SFE; SFR/Mgas) with ∆log(SSFR)MS as found locally by molecular gas studies. Secondly, at fixed ∆log(SSFR)MS, the constant dust temperature observed in galaxies probing wide ranges in SFR and M∗ can be explained by an increase or decrease in the number of star-forming regions with comparable SFE enclosed in them. And thirdly, at high redshift, the normalisation towards hotter dust temperature of the Tdust−∆log(SSFR)MS correlation can be explained by the decrease in the metallicities of galaxies or by the increase in the SFE of MS galaxies. All these results support the hypothesis that the conditions prevailing in the star-forming regions of MS and far-above-MS galaxies are different. MS galaxies have star-forming regions with low SFEs and thus cold dust, while galaxies situated far above the MS seem to be in a starbursting phase characterised by star-forming regions with high SFEs and thus hot dust.
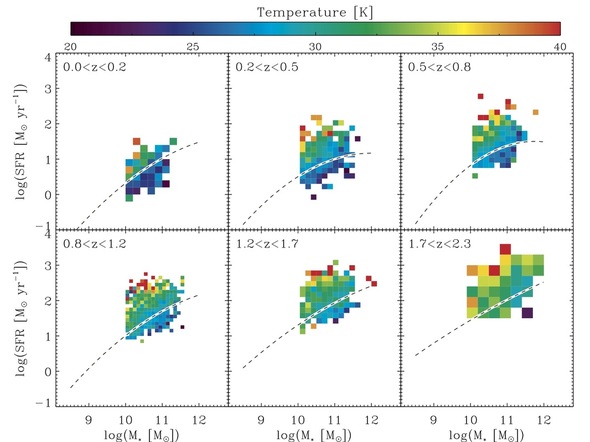
Mean dust temperature of galaxies in the SFR−M∗ plane as found from our stacking analysis. Short-dashed lines on a white background show the MS of star formation. Tracks of iso-dust-temperature are not characterised by vertical or horizontal lines but instead by approximately diagonal lines.
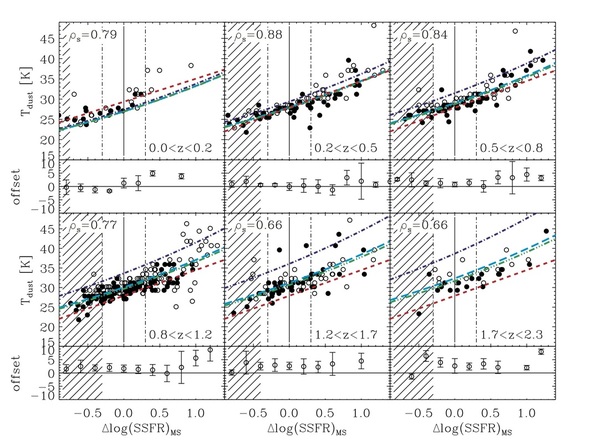
Dust temperature of galaxies as a function of ∆log(SSFR)MS, as derived from our stacking analysis. Empty circles show results for SFR−M∗ bins with low stellar masses, i.e., M∗ < 1010.5, 1010.7, 1010.7, 1010.8, 1010.8 and 1010.9 M⊙ in our 0 < z < 0.2, 0.2 < z < 0.5, 0.5 < z < 0.8, 0.8 < z < 1.2, 1.2 < z < 1.7 and 1.7 < z < 2.3 bins, respectively. Filled circles show results for SFR−M∗ bins with high stellar masses. In each panel, we give the Spearman correlation factor derived from our data points. Red dashed lines correspond to a linear fit to the data points of the 0.2 < z < 0.5 redshift bin. Green triple-dot-dashed lines represent predictions inferred from the variations of the SFE with ∆log(SSFR)MS and variations of the metallicity with redshift (see Eq. 10 and Eq. 11). Light blue long-dashed lines represent predictions inferred from the variations of the SFE with ∆log(SSFR)MS and variations of the normalisation of the SFE-∆log(SSFR)MS relation with redshift (see Eq. 10 and Eq. 13). Dark blue dot-dashed lines represent predictions inferred from the variations of the SFE with ∆log(SSFR)MS, and variations with redshift of the normalisation of the SFE-∆log(SSFR)MS relation and of the metallicity (see Eq. 10 and Eq. 14). Hatched areas represented the regions of parameter space affected by incompleteness (see text and Fig. 5). Vertical solid and dot-dashed lines show the localisation and width of the MS of star formation. The lower panel of each redshift bin shows the offset between the median dust temperature of our data points and the red dashed line, in bins of 0.2 dex.
