The 0 < z < 2.3 star formation history of the Universe as viewed in the far-infrared by Spitzer and Herschel
Magnelli et al. (2009, 2011, 2013)
We use the deepest mid- to far-infrared data obtained in the GOODS field by Spitzer (24um) and Herschel (100 and 160um) to estimate the evolution of the infrared luminosity function of galaxies form z~0 to z~2, Combined with the large wealth of multi-wavelength data available for the GOODS fields, these infrared luminosity function can be used to derived the cosmic star formation history over the last 10 billion years of the Universe. We find that the SFR density of the Universe strongly increased with redshift from z = 0 to z = 1.3 ( ~x 10), but is nearly constant at higher redshift out to z = 2.3. We also found that at z~2, the star-formation rate density of the Universe is dominated by luminous infrared galaxies (LIRGs and ULIRGs), i.e., galaxies relatively rare in the local Universe and forming stars at a large rate of >10 M⊙ yr-1.
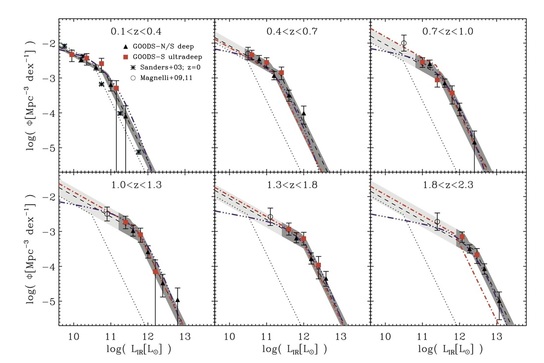
Infrared luminosity functions estimated in six redshift bins with the 1/Vmax method. Red squares and black triangles show results from our ultradeep (i.e., GOODS-S-ultradeep) and deep (i.e., GOODS-S-deep and GOODS-N) samples, respectively. Dashed lines represent the best fits to these data points with a double power-law function with fixed slopes. The shaded areas span all the solutions of these fits which are compatible, within 1σ, with our data points: the dark shaded parts of these areas highlight the luminosity ranges directly constrained by our PACS observations, while the light shaded parts highlight the luminosity ranges where our constraints rely upon extrapolations based on φknee and Lknee and a faint-end slope fixed at its z ∼ 0 value. Asterisks show the local reference, taken from Sanders et al. (2003), and the dotted line is the best fitted to these data points with our double power-law function with fixed slopes. Red dot-dashed lines are results from Magnelli et al. (2009, 2011) using deep MIPS-24 μm observations. Magnelli et al. (2009, 2011) used the same double power-law function that is used here. To illustrate the infrared luminosity range constrained by Magnelli et al. (2009, 2011), we show, as open circles, their lowest infrared luminosity bins. Blue triple-dot-dashed lines present results from Gruppioni et al. (2013) who used a different analytical function to fit their data points, in particular, a much shallower faint-end slope.
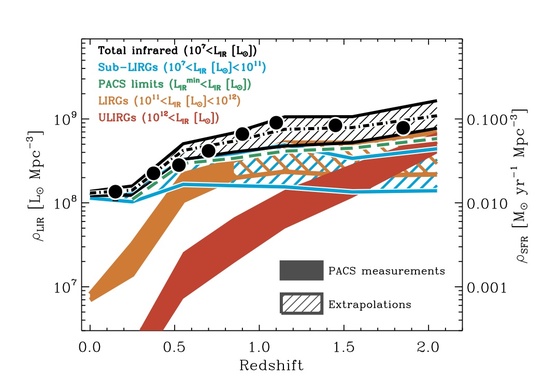
Evolution of the total comoving IR energy density
(black area) and the relative contribution of the “faint” galaxies (light blue area), LIRGs (orange area) and ULIRGs (red area). The black dot-
dashed line shows the best fit of the total comoving IR energy density, i.e., defined by integrating the IR LFs best-fitting our data points (see
dashed lines in Fig. 10). The green dashed line shows the best fit of the comoving IR energy density of galaxies which are above the PACS
detection limit of our ultradeep sub-sample (i.e., > Lmin). Black circles represent the total comoving IR energy density inferred by Gruppioni et al. IR
(2013). The right axis of the panel shows the evolution of the obscured SFR density assuming that SFR [M⊙ yr−1]= 10−10 × LIR [L⊙] for a Chabrier (2003) IMF.
