Evolution of the FIR/radio correlation of star-forming galaxies in the SFR-M∗ plane
Magnelli et al. (2015)
We study the evolution of the radio spectral index and far-infrared/radio correlation (FRC) across the star-formation rate – stellar masse (i.e. SFR−M∗) plane up to z∼2. We start from a stellar-mass-selected sample of galaxies with reliable SFR and redshift estimates. We then grid the SFR−M∗ plane in several redshift ranges and measure the infrared luminosity, radio luminosity, radio spectral index, and ultimately the FRC index (i.e. qFIR) of each SFR–M∗– z bin. The infrared luminosities of our SFR–M∗– z bins are estimated using their stacked far-infrared flux densities inferred from observations obtained with the Herschel Space Observatory. Their radio luminosities and radio spectral indices (i.e. α, where S ν ∝ ν−α ) are estimated using their stacked 1.4-GHz and 610-MHz flux densities from the Very Large Array and Giant Metre-wave Radio Telescope, respectively. Using this methodology, we constrain the radio spectral index and FRC index of star-forming galaxies. The radio spectral index of star-forming does not evolve significantly with redshift or with the distance of a galaxy with respect to the main sequence (MS) of the SFR−M∗ plane (i.e. ∆log(SSFR)MS = log[SSFR(galaxy)/SSFRMS(M∗, z)]). Instead, star-forming galaxies have a radio spectral index consistent with a canonical value of 0.8, which suggests that their radio spectra are dominated by non-thermal optically thin synchrotron emission. We find that the FRC index, qFIR, displays a moderate but statistically significant redshift evolution as qFIR(z)=(2.35 ± 0.08) × (1 + z)−0.12±0.04, consistent with some previous literature. Finally, we find no significant correlation between qFIR and ∆log(SSFR)MS, though a weak positive trend, as observed in one of our redshift bins (i.e., ∆[qFIR ]/∆[∆log(SSFR)MS ] = 0.22 ± 0.07 at 0.5 < z < 0.8), cannot be firmly ruled out using our dataset.
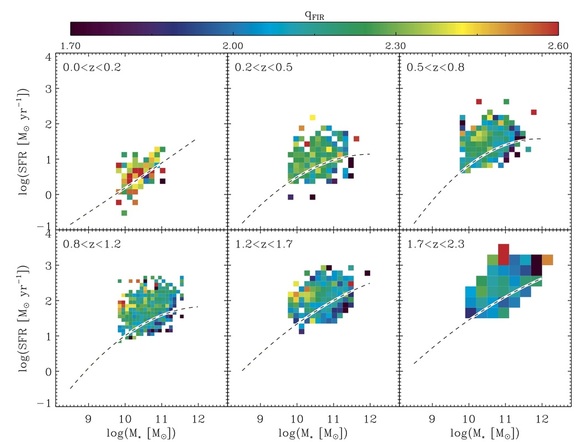
Evolution of the mean LFIR – to – L1.4 GHz ratio, i.e. qFIR (see Eq. 5), of galaxies in the SFR−M∗ plane, as found using our stacking analysis. Short-dashed lines on a white background show the MS of star formation.
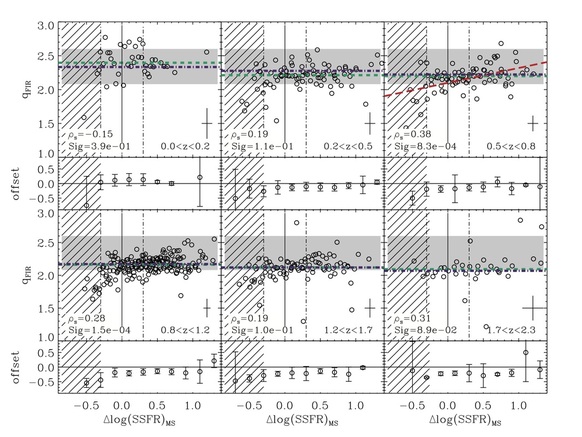
Mean LFIR – to – L1.4 GHz ratio (qFIR ) of galaxies as a function of ∆log(SSFR)MS , as derived from our stacking analysis. Hatched areas represent the regions of parameter space affected by incompleteness (see text and Fig. 4), while the light grey region shows the value of qFIR observed by Yun et al. (2001) in a large sample of local star-forming galaxies, qFIR (z ∼ 0) = 2.34 ± 0.26. In each panel, we show the median value (green dashed line), give the Spearman rank correlation (ρs) and the null hypothesis probability (Sig.) derived from data points in the region of parameter space not affected by incompleteness. Blue dot-dashed lines represent a redshift evolution of qFIR = 2.35 × (1 + z)−0.12 . In the lower right part of each panel, we give the median uncertainty on our qFIR estimates. Vertical solid and dot-dashed lines show the localisation and the width of the MS of star formation. In the redshift bin with a statistically significant correlation (Sig. < 5 % and χ2red [linear] < χ2red [cst], see text), we plot (red long-dashed line) a linear fit, qFIR = (0.22 ± 0.07) × ∆log(SSFR)MS + (2.10 ± 0.05). The lower panel of each redshift bin shows the offset between the median qFIR of our data and the local value of qFIR (z = 0) ≈ 2.34, in bins of 0.2 dex.
