Dust temperature and CO→H2 conversion factor variations in high-redshift galaxies
Magnelli et al. (2012b)
Deep Herschel PACS/SPIRE imaging and CO(2-1) line luminosities from the PdBI are combined for 17 galaxies at z > 1 in order to study for the first time the CO-to-H2 conversion factor (i.e., αCO) of a large sample of high-redshift star-forming galaxies. The sample includes galaxies both on and above the main sequence (MS) traced by star-forming galaxies in the SFR-M∗ plane. Like in the local Universe, the value of αCO is a ∼5x smaller in starbursts compared to normal star-forming galaxies (SFGs). We additionally uncover a relation between αCO and dust temperature (Tdust ; αCO decreasing with increasing Tdust ). We can unambiguously conclude that in galaxies of near-solar metallicity, a critical value of Tdust = 30K can be used to determine whether the appropriate αCO is closer to the “starburst” value (1.0 M⊙(K km s−1 pc2)−1, when Tdust > 30K) or closer to the Galactic value (4.35 M⊙(K km s−1 pc2)−1, when Tdust < 30K). This indicator has the great advantage of being less subjective than visual morphological classifications of mergers/SFGs, which can be difficult at high redshift because of the clumpy nature of SFGs. Using Tdust to select the appropriate αCO is also more indicative of ISM conditions than a fixed LIR criterion. In the absence of far-infrared data, the offset of a galaxy from the star formation main sequence (i.e., ∆log(SSFR)MS = log[SSFR(galaxy)/SSFRMS(M∗, z)]) can be used to identify galaxies requiring the use of an αCO conversion factor lower than the Galactic value (i.e., when ∆log(SSFR)MS 0.3 dex).
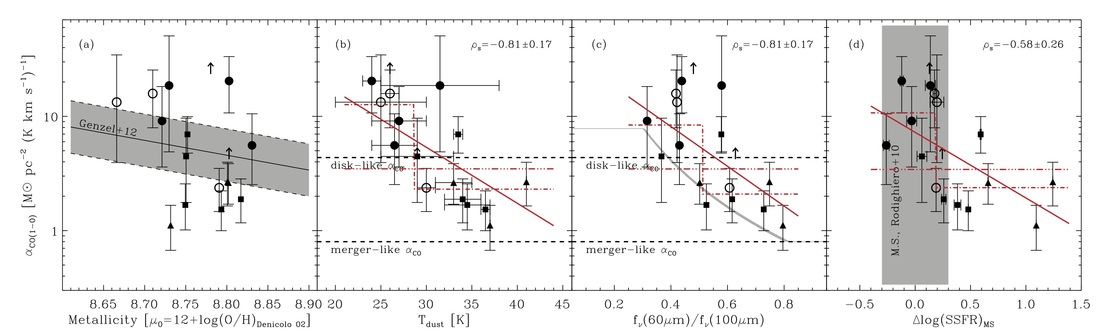
αCO(1−0) as function of metallicity (i.e., μ0), dust temperature derived from fitting a single modified blackbody function (i.e., Tdust, see Section 4.2), rest-frame far-infrared color (i.e., f60/f100) and distance with respect to the main sequence of star-formation (i.e., ∆log(SSFR)MS ). Filled and opened circles represent our 4 secure and 3 tentative IRAM CO detections, respectively. Our 2 IRAM CO upper limits are shown by arrows. BzK galaxies and SMGs are shown by filled squares and triangles, respectively. The shaded area in panel (a) represents the αCO(1−0)-μ0 relation and its 1σ uncertainty as found in Genzel et al. (2012). The shaded area in panel (d) represents the 1σ scatter around the MS of Rodighiero et al. (2010). The grey line in panel (c) represents the empirical αCO(1−0)-f60/f100 relation observed in the local Universe by Gracia ́-Carpio et al. (2011). Red lines in panel (b), (c) and (d) present fits to the data points using a constant (dashed-triple-dotted line), a step (dashed-dotted line) and a linear (solid) function. Red lines are intentionally limited to the parameter space in which we have direct constraints.
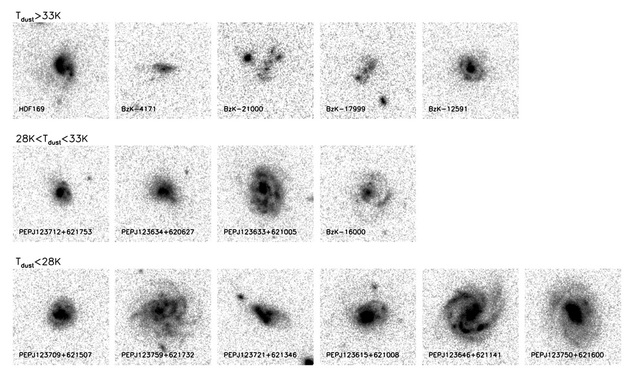
z-band (i.e., F850LP) images from the Hubble Space Telescope for galaxies in our sample with 1.0 < z < 1.6 (i.e., all but two galaxies of our sample). Each image is 40 kpc × 40 kpc, and galaxies are ordered based on their dust temperatures. On average, the galaxies with Tdust < 28 K have disk-like morphologies (i.e., PEPJ123709+621507, PEPJ123759+621732, PEPJ123615+621008, PEPJ123646+621141, PEPJ123750+621600) while most of the galaxies with Tdust > 33 K are more compact and irregular/clumpy.
